Getting Started
This guide will help you perform your first semantic literature search and understand LitView’s cluster visualization in under 10 minutes.
Quick Start: Your First Search
Step 1: Access LitView
Navigate to litview.org and log in with your institutional credentials or create a new account.
What You’re Seeing
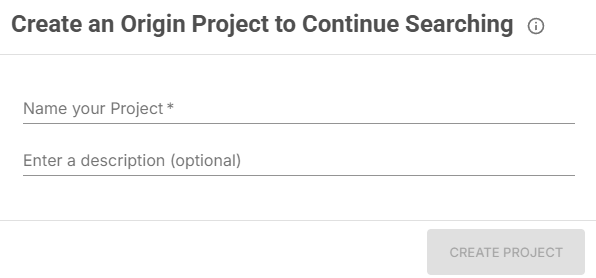
Before starting your search, LitView asks you to select a project. Projects are like research folders that help you organize papers by topic or research goal.
Step 2: Build Your Search Query
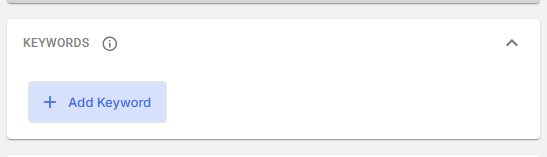
Add Keywords
- Enter your first keyword or phrase in the text field
- Click “Add Keyword” - it will appear as a coloured tag
- Add 2-4 related keywords for comprehensive coverage
- Use “AND” and “OR” operators to refine your search logic
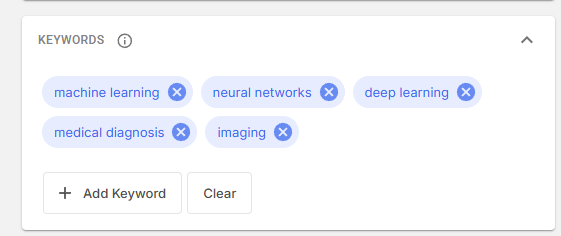
Example Search Strategy:
Primary keyword: “machine learning” Related terms: “neural networks” OR “deep learning” Context: “medical diagnosis” AND “imaging”
Upload Context Documents (Optional)
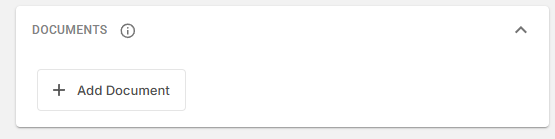
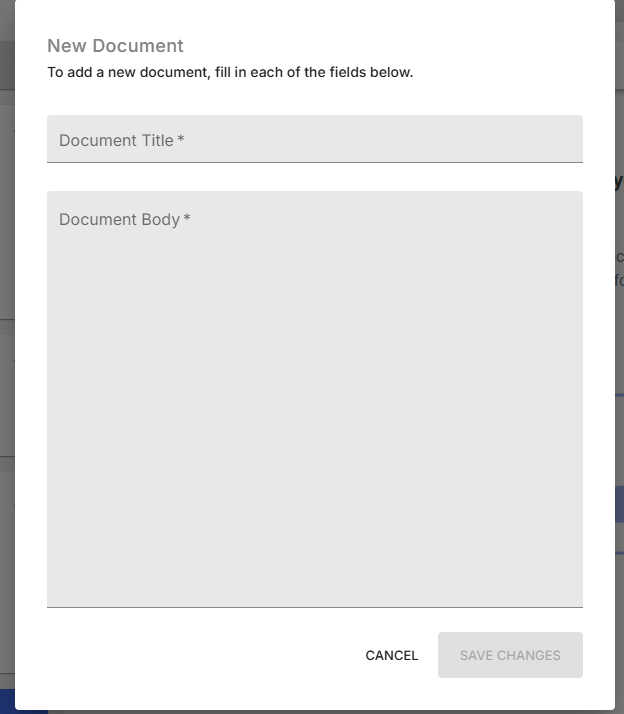
- Click “+ ADD DOCUMENT” in the DOCUMENTS section
- Upload the content of your key papers you already know are relevant
- These will appear in your cluster map for reference positioning
Step 3: Select Your Database
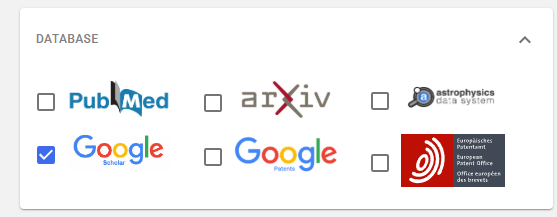
- In the DOMAIN dropdown, select your target database
- PubMed: Biomedical and life sciences literature
- Google Scholar: Broad academic coverage across disciplines
- ArXiv: Physics, mathematics, computer science preprints
- Astrophysics Data System (ADS): NASA’s digital library for astronomy and astrophysics literature.
- Google Patents: A searchable database of patents and patent applications worldwide.
- European Patent Office (EPO): The official database for European patents and legal status information.
Step 4: Generate Your Research Map

Click the “SEARCH” button and wait for processing (typically 30-60 seconds).
LitView will analyze thousands of papers and create a semantic cluster visualization showing how research concepts relate to each other.
Understanding Your Results**
The Cluster Map Visualization
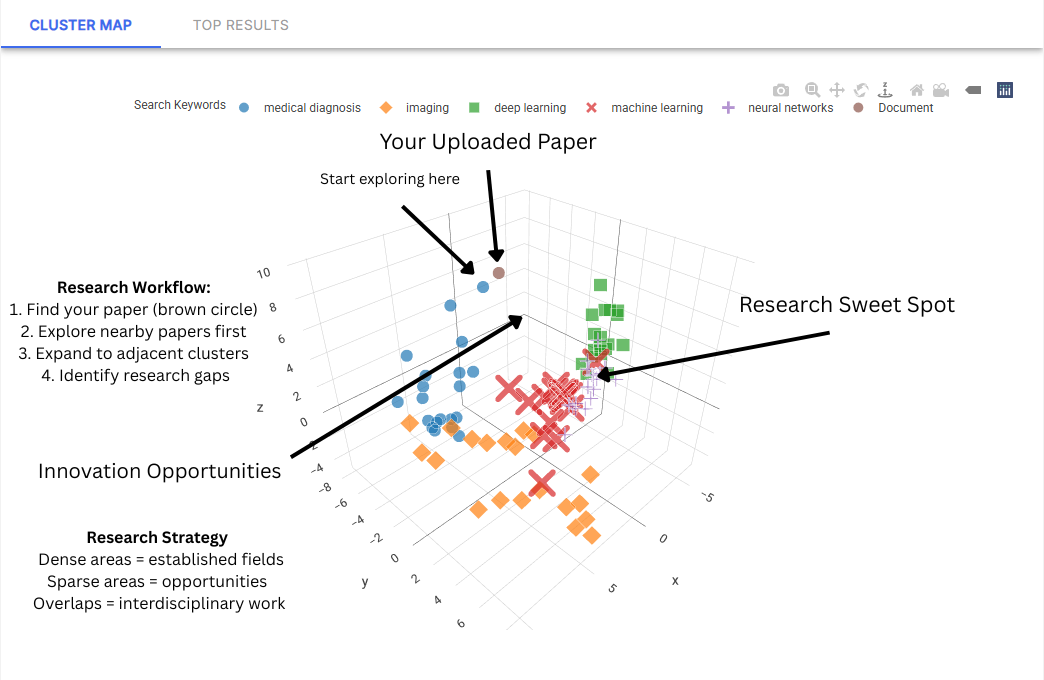
When your search completes, you’ll see an interactive scatter plot where:
- Each dot represents a research paper
- Colors correspond to your keywords (shown in the legend)
- Proximity indicates conceptual similarity - papers close together share similar ideas
- Clusters reveal research themes - dense areas show established research topics
The Details Panel
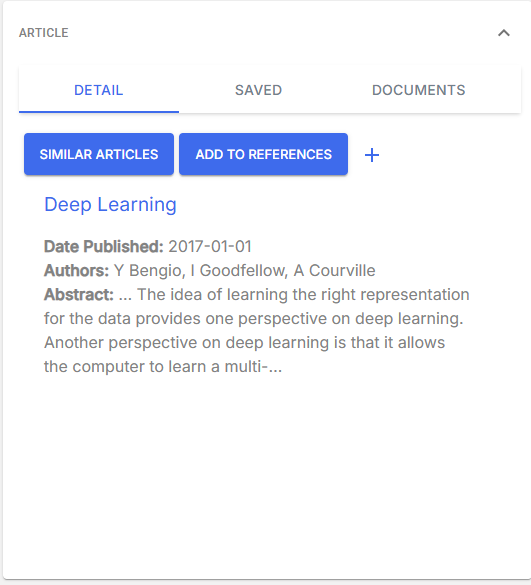
Click any dot on the cluster map to view:
- Paper title and abstract
- Direct link to full document
- Relevance indicators - position within keyword clusters
Interactive Features
Keyword Toggling: Click keywords in the legend to show/hide papers associated with specific terms.
Zoom and Pan: Use mouse controls to explore different areas of the research landscape.
Document Integration: Your uploaded documents appear with special markers for easy reference.
Interpreting Research Clusters
High-Value Areas
Dense Clusters: Areas with many overlapping dots indicate well-established research topics with significant literature.
Multi-Keyword Overlap: Regions where different colored dots (keywords) cluster together reveal interdisciplinary connections.
Zone of Interest: Look for the area where your most important keywords converge - this is usually your core research territory.
Research Opportunities
Sparse Regions: Areas with few papers between established clusters may indicate research gaps.
Isolated Clusters: Papers that don’t fit main groupings might represent emerging or niche research areas.
Keyword Gaps: If certain keyword combinations don’t overlap, there may be unexplored connections to investigate.
Your First Research Analysis
1. Identify Your Core Territory
Find the cluster where your main keywords overlap most heavily. This represents the established research conversation in your area.
2. Explore the Periphery
Look at papers near but not within your main cluster. These often provide valuable context or methodological insights.
3. Check for Surprises
Are there unexpected keyword combinations? Papers in surprising locations? These can lead to innovative research directions.
4. Assess Coverage
Does the cluster map reveal areas you hadn’t considered? Missing perspectives that should inform your research?
Moving to Projects
Save Your Research
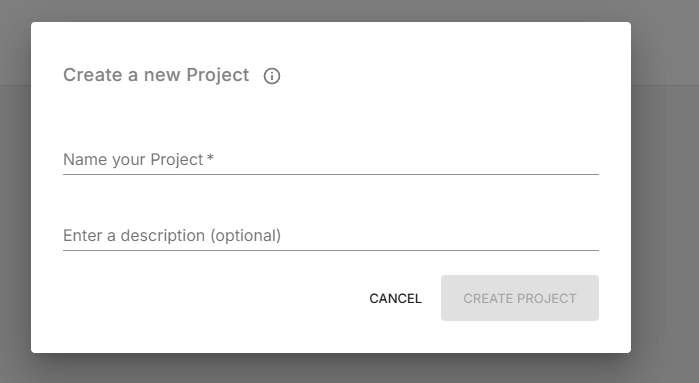
- Navigate to the Projects tab
- Create a new project with a descriptive name
- Save relevant papers from your search results
- Organize findings by themes identified in your cluster analysis
Build Your Literature Collection
Use cluster insights to guide systematic literature collection:
- Core papers: From the densest part of your main cluster
- Methodological papers: From related methodology clusters
- Contextual papers: From adjacent but distinct research areas
- Emerging work: From sparse or peripheral regions
Refine Your Search Strategy
Based on your first results:
- Add new keywords discovered through cluster analysis
- Remove irrelevant terms that led to off-topic clusters
- Upload additional context documents to improve positioning
Explore Advanced Features
- References Tab: Organize your findings into citation-ready collections
- Notebook Tab: Combine literature analysis with computational research (experimental)
Get Help When Needed
- Search not finding key papers? → Troubleshooting Search Results
- Cluster map looks confusing? → Advanced Cluster Interpretation
Common First-Time Questions
Q: Why don’t I see a paper I know should be relevant?
A: Try adding the paper’s key terms as additional keywords, or upload the paper directly to see where it positions in your research landscape.
Q: My cluster map looks scattered - is this normal?
A: Yes! This often indicates you’re working in an interdisciplinary area. Look for smaller sub-clusters and consider narrowing your search scope.
Q: How many keywords should I use?
A: Start with 3-5 keywords. Too few may miss important connections; too many can create overly complex visualizations.
Q: Can I save and return to my search results?
A: Yes! Use the Projects feature to save your research configuration and results for future reference and development.